In a competitive talent market, companies are reevaluating executive compensation packages to attract and retain top leadership. Compensation generally includes a base level of compensation combined with some form of incentive compensation tied to performance. Developing a compensation program that links entity value growth with management’s performance can be very challenging. This is compounded when attempting to develop multi-year performance goals for management in a volatile business environment. Companies have many alternatives for incentive compensation programs. Stock options and restricted stock have unique challenges, and there is not necessarily a high correlation between executive performance and the value the executives receive as compensation. Executives may receive value if the company remains viable and the recipient does not quit or is not terminated. These forms of incentive compensation are also frequently tied to a predetermined plan or budget. Associating compensation to someone’s forecast of future results rather than delivered results has limitations. For these reasons, many energy companies in the current environment have focused incentive compensation plans around relative total shareholder return (TSR) plans. The following is a discussion of TSR plans, the associated accounting implications, and their valuation challenges.
Understanding the Role of Relative TSR Plans
A TSR plan measures the company’s return against the performance of a peer group of competitors over a given period. The company's results against the peer group are then used to determine whether vesting of the award is achieved and at what payout level. The plan intends to compensate executives for their performance relative to peers, where executives are encouraged to match or beat competitors' performance. By assessing performance relative to peers, a TSR plan normalizes the measurement to remove the effects of conditions affecting the entire industry. It focuses less on short-term stock price swings and requires sustained performance over time. The recipients can benefit from the award if the company outperforms the peer group.
A TSR plan design has various components, such as the peer group, the performance period considered, stock price averaging formulas, payout structures, and free cash flow requirements. The peer group is one of the most important elements. The peer group companies are generally public companies that allow for the use of publicly available stock price closes and other financial information. The group provides a readily available metric for companies to access, and it frequently reduces subjectivity and the measurement burden. While a company can determine which companies are included in the peer group, establishing the peer companies can be challenging. The peer companies do not have to be identical (i.e., same basin, natural gas/crude asset base, midstream assets composition, etc.). Still, there is generally a high level of commonality among the companies. In addition, companies in the peer group may not exist by the end of the performance period due to merger, acquisition, or bankruptcy.
Accounting and Valuation Implications of TSR Plans
The US GAAP accounting treatment for TSR awards falls under the guidance of ASC 718, “Compensation-Stock Compensation.” Forms of compensation where the compensation received is tied to the market price of company stock generally fall under this accounting guidance. The primary forms of share-based compensation considered under the guidance are stock options, stock appreciation rights, and restricted stock units. TSR awards are performance-based restricted stock units, or performance shares, where the TSR serves as the performance metric. The accounting treatment for performance shares depends on whether the metrics are based on a performance condition (e.g., EPS, net income, etc.) or a market condition (e.g., a company’s stock performance relative to a peer group or an index). The general accounting objective is to record the fair value of compensation expense over the period services are performed. This requires determining the compensation's fair value and the time participants perform the services.
The accounting treatment of TSR awards will depend on whether the awards are recorded as equity or liability. If they are recorded as equity, the amount of compensation is estimated at the grant date at fair value. This amount is expensed over the service period. The fair value must be remeasured every reporting period until settlement if they are recorded as a liability. Fluctuations in the fair value of the liability award are recorded as increases or decreases in compensation cost, either immediately or over the remaining service period, depending on the vested status of the award.
Equity vs. Liability Classification: Determining Factors
Determining whether the TSR awards are recorded as equity or liability can be complicated. TSR plans are generally structured in a manner that allows equity classification. However, the following is a list of characteristics that would likely trigger liability accounting:
- Awards must be cash-settled or require cash settlement on the occurrence of a contingent event that is considered probable.
- Awards can be settled in cash or stock at the option of the employee at any time or on the occurrence of a contingent event that is considered probable.
- Conditions other than service, performance, or market conditions affect their fair value, exercisability, or vesting.
- Instruments that are equity in form, but the employer has a practice of cash-settling the instruments.
- Awards where the employer can choose cash or share settlement, but cannot control delivery of shares.
The fair value recorded is largely impacted by the determination of service, performance, and market conditions stated in the TSR plan document.
- A service condition requires the individual to remain employed by the company for a stated period of time in order to earn the right to the related equity instrument (i.e., to vest).
- A performance condition is a condition that is based on the operations or activities of the employer. The condition may relate to the performance of the entire company, a division, or an individual employee.
- A market condition references the exercisability or other payment terms directly or indirectly that may be dependent on achieving a specified stock price or a specified return on the stock price (e.g., price appreciation plus dividends).
Vesting Conditions and Their Impact on Fair Value
Each of these terms and conditions may have a direct or indirect effect on the fair-value-based measure of the award. Vesting conditions are not directly incorporated into the fair-value-based measure of an award. Rather, an entity uses vesting conditions to determine whether an award has been earned and, therefore, whether to record compensation costs for the award. Service and performance conditions are considered vesting conditions. The service or performance condition must be satisfied for an employee to earn an award. Compensation cost is only recognized for awards earned or expected to be earned. Compensation cost is not recognized for awards forfeited or expected to be forfeited because a service or performance condition is not achieved. Unlike a service or performance condition, a market condition is not a vesting condition. Rather, a market condition is factored into the grant-date fair-value-based measure of an award. Accordingly, regardless of whether the market condition is satisfied, an entity may still be required to recognize compensation costs for the award.
Performance Metrics in TSR Plans: Accounting Classifications
There are two accounting classifications of performance metrics. The first is performance conditions, such as EPS, revenue target, or market share. The second is market conditions, such as relative TSR, stock price, absolute TSR, or internal rate of return. Therefore, for accounting purposes, relative TSR awards are restricted stock units with a market condition where the vesting is contingent on the share price performance over a given period.
The following is an example of performance shares with a performance condition:
- The number of performance shares earned is based on EPS target at the end of three years.
- Grant date stock price is $12.
- 1,000 target performance shares are granted.
- At the grant date, the company expects 100% of the performance shares to be earned. The total expense is $12,000. Therefore $4,000 in expense is amortized each year over three years.
- After two years, the company expects 150% of the performance shares to vest. Therefore, a true up amount of $4,000 is recognized immediately, and $6,000 is amortized over the last year.
The following is an example of performance shares, with a market condition:
- The number of performance shares earned is based on relative TSR over a three-year period.
- Grant date stock price is $10 and estimated grant date fair value is $12.
- 1,000 target performance shares are granted.
- The total expense is $12,000. Therefore, $4,000 in expenses is amortized yearly for over three years.
- At the end of the performance period, the actual performance earns 150% of the performance shares (or $15 per share).
- No change to expense would be made because the grant-date fair value accounted for the probability of earning between 0% and 200% of the target.
Valuation Challenges and the Role of Monte Carlo Simulation
Valuations of TSR awards are used to develop compensation expenses for financial reporting purposes, which presents unique valuation issues. Market conditions of TSR awards must be reflected in the grant-date fair value of the awards. To do that, a Monte Carlo simulation model is often necessary. Using a risk-neutral framework, the simulation model forecasts future share prices for the company and the peer group. Under the risk-neutral framework, future share prices are assumed to grow at an annual rate of return equal to the risk-free interest rate, similar to how a Black-Scholes model works. In valuing a plain vanilla option, a Monte Carlo and a Black-Scholes model would yield the same value conclusion if identical assumptions were used. However, the Monte Carlo model provides more flexibility, allowing the user to customize the model in ways not possible with a Black-Scholes model. This customization characteristic is also what makes the Monte Carlo model more difficult to implement, as each model is prepared on an individual basis in accordance with the terms of the awards valued.
A Monte Carlo simulation is a generally accepted procedure for sampling random movements of future share prices. It is often implemented using a computer program to generate many possible results. The simulation model forecasts the future movement of share prices using several key inputs combined with empirical knowledge of the stochastic (random) process that governs stock price behavior. Geometric Brownian Motion is the most widely used stochastic process for modeling stock price behavior, and its analytic solution is shown below.
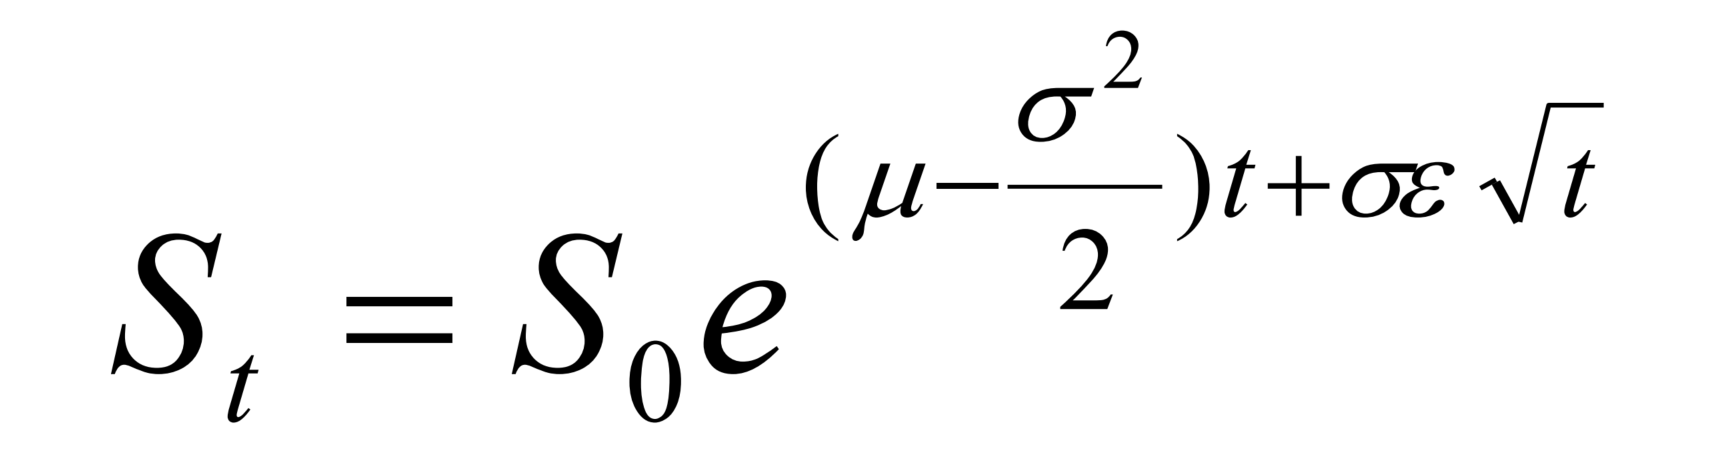
The following discusses the equation and how each input impacts the evaluation.
Stock Prices
In the above equation, S_t represents the forecasted stock price at a future point in time (t). S_0 is the starting stock price input used for the simulation analysis, and it is based on the stock price at the valuation date, or t=0. The valuation date, or grant date of the TSR award, may not always coincide with the beginning of the performance period. Most of the time, the performance periods, as defined in TSR plans, start a few months before the award's grant date. In such cases, the fair value of the TSR award, as estimated using the Monte Carlo simulation model, will be impacted by how the company stock price has performed relative to the peer group between the beginning of the performance period and the grant date. For example, if the company’s stock price has underperformed relative to its peers in that period, there will be a greater probability of a lower payout, resulting in a lower fair value conclusion.
Risk-free Rate
The expected average annual rate of return of the stock price appreciation is represented by mu(µ). For US companies, the annual rate of return, or risk-free interest rate, is determined by observing the US Treasury zero-coupon yields over a period commensurate with the time remaining in the forecast period or the performance period of the relative TSR award. The risk-free interest rate for foreign companies is based on the implied yield available on zero-coupon government issues denominated in the market's currency, where the shares primarily trade. Although an increase in the risk-free interest rate will result in a greater probability of a higher last-day stock price, it will also result in a higher discount rate used to present the estimated future value of the award. Furthermore, because the risk-free interest rate assumption is the same for forecasted future stock prices of the company and its peer companies, the final payout in a TSR award will not be affected by movements in the risk-free interest rate. Therefore, the net effect of an increase in the risk-free interest rate on the fair value of a TSR award is zero.
Volatility
The volatility of the stock price, or sigma(σ), represents the expected degree of variation in stock price over the time remaining in the performance period of the TSR award. In accordance with ASC 718 guidance, expected volatility should be measured using a combination of historical volatility (based on a standard deviation of actual returns) and implied volatility (based on the volatility of traded options). However, practitioners tend to rely strictly on historical volatility when estimating the volatility assumption for relative TSR awards. This ensures that the volatility assumption is the same as the correlation coefficient assumptions, which can only be estimated using historical data. An alternative approach might be to prepare two price paths in the simulation model, where the first path uses a volatility assumption based on historical volatility alone, and the second path uses a volatility assumption based on a combination of historical and implied volatility (per ASC 718). The first path would calculate the company’s relative TSR rank compared to the peer companies. In contrast, the second path would project the company’s final stock price at the end of the performance period. An increase in the volatility of the subject company, when the volatilities of all peer companies remain the same, will decrease the fair value conclusion due to a lower probability of stock price appreciation. Conversely, an increase in the volatility of the peer group companies, when the volatility of the subject company remains the same, will increase the fair value conclusion due to a greater probability of higher payouts.
Random Numbers and Correlations
In the above equation, epsilon(ε) is a random number normally distributed with a mean equal to zero and a standard deviation equal to one. The random numbers in the Monte Carlo simulation are adjusted using Cholesky Decomposition to arrive at correlated random numbers. The Cholesky Decomposition is a pair-wise correlation coefficient matrix that reflects the historical relationship between the stock returns of the company and the peer companies over a period commensurate with the performance period. As such, the correlations are incorporated into the random numbers to govern the behavior of future stock prices for the company and the peer group in accordance with historical observations. The greater the number of peer companies, the bigger the correlation coefficient matrix and the longer the Monte Carlo simulation model will take to run. The direction and magnitude of the future stock price movement at each time step is influenced by the correlated random number.
Dividends
When forecasting future stock prices for relative TSR awards, the treatment of dividends should be carefully assessed. In most cases, the calculation of the payout percentage, as defined in TSR plans, assumes dividends are reinvested into the company and each peer company as they are paid. This can be incorporated into the Monte Carlo simulation by assuming a zero percent dividend yield, which is mathematically equivalent to the assumption that dividends are reinvested as paid out. Additionally, practitioners must evaluate whether the holders of the TSR awards are eligible to receive dividend payments over the performance period and evaluate the form of those dividend payments (cash or equity). If the treatment of dividends differs from the payout percentage, then a separate price path should be generated for the subject company’s final stock price, incorporating the treatment of dividend equivalents during the performance period. If dividends are to be paid in cash, they are considered a liability, should be tracked separately, and likely marked to market quarterly.
Incorporating TSR Plans for Shareholder Value Enhancement
As companies navigate the intricacies of executive compensation and seek to align incentives with shareholder interests, adopting relative total shareholder return (TSR) plans becomes increasingly pertinent, particularly amid volatile market conditions. These plans are powerful tools to incentivize executives to enhance shareholder value and foster prudent investments. As such, companies must meticulously assess the accounting and valuation implications of TSR plan terms, recognizing their profound impact on ongoing financial reporting and classification as equity or liability. Moreover, the complexities inherent in these terms may necessitate specialized valuation expertise beyond the company's internal resources. By incorporating TSR plans into their compensation strategies, companies encourage shareholder reinvestment and portfolio optimization and potentially bolster capital gains through initiatives such as share repurchase programs.